Market Outlook
February 14, 2018
Market Cues
Domestic Indices
Chg (%)
(Pts)
(Close)
Indian markets are likely to open positive tracking global indices and SGX Nifty.
BSE Sensex
0.9
295
34,300
US stocks turned higher over the course with the turnaround, with the major
Nifty
0.8
85
10,540
averages extended the upward move seen over the two previous sessions. The Dow
Mid Cap
1.3
218
16,852
Jones ended up 0.2% to close at 24,640 and the Nasdaq Composite edged
Small Cap
1.6
290
18,463
advanced to 0.5%, to 7,014.
Bankex
0.7
198
29,080
U.K. shares were subdued on last trading session after data showed U.K. consumer
price inflation held steady at 3.0 percent in January year-over-year, missing
Global Indices
Chg (%)
(Pts)
(Close)
expectations of 2.9 percent. The FTSE 100 was down by 0.1% to close at 7,168.
Dow Jones
0.2
39
24,640
Nasdaq
0.5
32
7,014
On domestic front, Indian markets remain closed on Tuesday on account of
Mahashivratri. Positive cues from global markets helped benchmark indexes recover
FTSE
(0.1)
(9)
7,168
from their biggest weekly losses since August on Monday. The Sensex ended on an
Nikkei
(0.6)
(137)
21,107
upside front of 0.9% at 34,300 while the Nifty ended at 10,540 with an upside of
Hang Seng
0.7
196
30,036
0.8%.
Shanghai Com
(0.2)
(5)
3,180
News Analysis
Advances / Declines
BSE
NSE
Yogi Adityanath seeks Rs 380bn grant from Centre for development projects
Advances
2,084
1,429
Detailed analysis on Pg2
Declines
787
383
Investor’s Ready Reckoner
Unchanged
131
49
Key Domestic & Global Indicators
Stock Watch: Latest investment recommendations on 150+ stocks
Volumes (` Cr)
Refer Pg5 onwards
BSE
4,718
NSE
30,901
Top Picks
CMP
Target
Upside
Company
Sector
Rating
(`)
(`)
(%)
Net Inflows (` Cr)
Net
Mtd
Ytd
Blue Star
Capital Goods
Buy
739
867
17.3
FII
(1,394)
(4,967)
8,017
Dewan Housing Finance
Financials
Buy
525
712
35.7
Asian Granito
Other
Buy
516
651
26.1
*MFs
142
3,785
12,808
Navkar Corporation
Other
Buy
175
265
51.6
KEI Industries
Capital Goods Accumulate
390
436
11.9
Top Gainers
Price (`)
Chg (%)
More Top Picks on Pg4
LTTS
1,481
13.2
Key Upcoming Events
SCI
86
10.3
Previous
Consensus
Date
Region
Event Description
FSL
48
8.1
Reading
Expectations
BANKBARODA
169
7.8
Feb14
India
Monthly Wholesale Prices YoY%
3.58
3.20
Feb14
Euro Zone Euro-Zone GDP s.a. (QoQ)
0.60
0.60
IDBI
68
7.6
Feb14
US
Consumer price index (mom)
0.20
0.30
Feb14
US
Industrial Production
0.89
0.20
Top Losers
Price (`)
Chg (%)
Feb15
Germany
GDP nsa (YoY)
2.30
2.20
More Events on Pg7
FORTIS
139
(6.1)
HEXAWARE
330
(3.5)
BAJAJELEC
519
(3.4)
SBIN
289
(2.7)
CROMPTON
237
(2.7)
As on February 12 2018
Market Outlook
February 14, 2018
News Analysis
Yogi Adityanath seeks Rs 380bn grant from Centre for development
projects
The Yogi Adityanath government in Uttar Pradesh has demanded release of grants
worth Rs 380 billion for different projects from the Narendra Modi government at
the Centre.
The Adityanath government has claimed the funds were meant to be released
during the previous Akhilesh Yadav regime, however, the latter failed to take
follow up action and such the grants were still outstanding. The incumbent state
government has established a channel of communication with the federal policy
think tank, Niti Aayog for getting the grants released.
Economic and Political News
Dec industrial production grows 7.1%; Jan retail inflation eases to 5.07%
EAC-PM brainstorms over world's largest health protection scheme
Mega healthcare plan to boost India's insurance sector
Corporate News
Aditya Birla to invest Rs 10bn a year in NBFC and housing finance company
Delhi HC directs CIL to give full coal supply to R-Power for Butibori units
CCI approves Reliance Infra's Rs 188-bn deal with Adani Transmission
Car sales hit slow lane in Jan, but overall PV sales grow 7.6%
Market Outlook
February 14, 2018
Quarterly Bloomberg Brokers Consensus Estimate
Sun Pharma Ltd - Feb 14, 2018
Particulars ( ` cr)
3QFY18E
3QFY17
y-o-y (%)
2QFY18
q-o-q (%)
Sales
6960
7925
(12.2)
6650
4.6
EBIDTA
1522
2453
(37.9)
1375
10.7
%
21.9
30.9
20.7
PAT
943
1722
(45.2)
1001
(5.8)
Nestle Ltd. - Feb 14, 2018
Particulars ( ` cr)
4QCY17E
4QCY16
y-o-y (%)
3QCY17
q-o-q (%)
Sales
2528
2266
11.6
2514
0.6
EBIDTA
566
388
45.9
584
3.0
%
22.4
17.2
23.2
PAT
317
195
62.6
343
(7.9)
Tata Power Ltd. - Feb 14, 2018
Particulars ( ` cr)
3QFY18E
3QFY17
y-o-y (%)
2QFY18
q-o-q (%)
Sales
7558
6683
13.1
7657
0.6
EBIDTA
1650
1402
17.9
1436
3.0
%
21.8
20.9
18.8
PAT
414
679
(39.0)
268
54.5
Apollo Hospital Ltd. - Feb 14, 2018
Particulars ( ` cr)
3QFY18E
3QFY17
y-o-y (%)
2QFY18
q-o-q (%)
Sales
1947
1680
15.9
1851
5.2
EBIDTA
214
194
10.3
221
(3.2)
%
10.9
11.5
11.9
PAT
70.2
72.8
(3.6)
70.9
(0.9)
Grasim Ltd. - Feb 14, 2018
Particulars ( ` cr)
3QFY18E
3QFY17
y-o-y (%)
2QFY18
q-o-q (%)
Sales
3568
2525
41.3
4037
(11.6)
EBIDTA
793
542
46.3
731
8.5
%
22.2
21.4
18.1
PAT
463
331
39.8
574
((19.3)
Market Outlook
February 14, 2018
Top Picks
Market Cap
CMP
Target
Upside
Company
Rationale
(` Cr)
(`)
(`)
(%)
Strong growth in domestic business due to its leade`hip
in acute therapeutic segment. Alkem expects to launch
Alkem Laboratories
26,065
2,180
2,441
12.0
more products in USA, which bodes for its international
business.
We expect the company would report strong profitability
Asian Granito
1,553
516
651
26.1
owing to better product mix, higher B2C sales and
amalgamation synergy.
Favorable outlook for the AC industry to augur well for
Cooling products business which is out pacing the
Blue Star
7,092
739
867
17.3
market growth. EMPPAC division's profitability to
improve once operating environment turns around.
With a focus on the low and medium income (LMI)
consumer segment, the company has increased its
Dewan Housing Finance
16,453
525
712
35.7
presence in tier-II & III cities where the growth
opportunity is immense.
Loan growth is likely to pick up after a sluggish FY17.
Lower credit cost will help in strong bottom-line growth.
Karur Vysya Bank
8,326
115
160
39.6
Increasing share of CASA will help in NIM
improvement.
High order book execution in EPC segment, rising B2C
KEI Industries
3,053
390
436
11.9
sales and higher exports to boost the revenues and
profitability
Expected to benefit from the lower capex requirement
Music Broadcast
2,027
355
475
33.7
and 15 year long radio broadcast licensing.
Massive capacity expansion along with rail advantage
Navkar Corporation
2,630
175
265
51.6
at ICD as well CFS augur well for the company
Strong brands and distribution network would boost
Siyaram Silk Mills
3,139
670
851
27.1
growth going ahead. Stock currently trades at an
inexpensive valuation.
Market leadership in Hindi news genre and no.
2
viewership ranking in English news genre, exit from the
TV Today Network
2,839
476
508
6.7
radio business, and anticipated growth in ad spends by
corporate to benefit the stock.
After GST, the company is expected to see higher
volumes along with improving product mix. The Gujarat
Maruti Suzuki
2,75,077
9,106
10,619
16.6
plant will also enable higher operating leverage which
will be margin accretive.
We expect loan book to grow at 24.3% over next two
GIC Housing
2,188
406
655
61.2
year; change in borrowing mix will help in NIM
improvement
We expect CPIL to report net Revenue/PAT CAGR of
~17%/16% over FY2017-20E mainly due to healthy
7,293
328
400
21.9
growth in plywood & lamination business, forayed into
Century Plyboards India
MDF & Particle boards on back of strong brand &
distribution network.
We expect sales/PAT to grow at 13.5%/20% over next
LT Foods
2,947
92
128
38.9
two years on the back of strong distribution network &
addition of new products in portfolio.
We expect financialisation of savings and increasing
Aditya Birla Capital
36931
168
230
36.9
penetration in Insurance & Mutual fund would ensure
steady growth.
Source: Company, Angel Research
Market Outlook
February 14, 2018
Fundamental Call
Market Cap
CMP
Target
Upside
Company
Rationale
(` Cr)
(`)
(`)
(%)
CCL is likely to maintain the strong growth trajectory
CCL Products
3,906
294
360
22.6
over FY18-20 backed by capacity expansion and new
geographical foray
We forecast Nilkamal to report top-line CAGR of ~9%
to `2,635cr over FY17-20E on the back of healthy
Nilkamal
2,680
1,796
2,178
21.3
demand growth in plastic division. On the bottom-line
front, we estimate ~10% CAGR to `162cr owing to
improvement in volumes.
We expect sales/PAT to grow at 9%/14% over next two
years on the back of healthy demand growth in
Shreyans Industries
232
168
247
47.3
printing. Further, China had banned making paper
from waste pulp which would benefit Indian paper
companies.
The prism has diversified exposure in the different
segment such as Cement, Tile & ready mix concrete.
Prism Cement
6,861
136
160
17.4
Thus we believe, PCL is in the right place to capture
ongoing government spending on affordable housing
and infrastructure projects.
Source: Company, Angel Research
Market Outlook
February 14, 2018
Key Upcoming Events
Result Calendar
Date
Company
February 14, 2018
Nestle, Monnet Ispat, Goodyear, Banco, Sun Pharma, Tata Power Co., HDIL, MT Educare
February 15, 2018
Vesuvius India
Source: Bloomberg, Angel Research
Global economic events release calendar
Bloomberg Data
Date
Time
Country
Event Description
Unit
Period
Last Reported
Estimated
Feb 12, 2018
5:30 PMIndia
Industrial Production YoY
% Change
Dec
8.40
6.00
Feb 13, 2018
3:00 PMUK
CPI (YoY)
% Change
Jan
3.00
2.90
Feb 14, 2018
12:00 PMIndia
Monthly Wholesale Prices YoY%
% Change
Jan
3.58
3.20
3:30 PMEuro Zone Euro-Zone GDP s.a. (QoQ)
% Change
4Q P
0.60
0.60
7:00 PMUS
Consumer price index (mom)
% Change
Jan
0.20
0.30
7:45 PMUS
Industrial Production
%
Jan
0.89
0.20
Feb 15, 2018
12:30 PMGermany GDP nsa (YoY)
% Change
4Q P
2.30
2.20
7:00 PMUS
Initial Jobless claims
Thousands
Feb 10
221.00
227.50
India
Imports YoY%
% Change
Jan
21.10
India
Exports YoY%
% Change
Jan
12.40
US
Producer Price Index (mom)
% Change
Jan
(0.30)
Feb 16, 2018
7:00 PMUS
Housing Starts
Thousands
Jan
1,192.00
1,231.00
7:00 PMUS
Building permits
Thousands
Jan
1,300.00
1,300.00
Feb 20, 2018
8:30 PMEuro Zone Euro-Zone Consumer Confidence
Value
Feb A
1.30
Feb 21, 2018
2:00 PMGermany PMI Services
Value
Feb P
57.30
Source: Bloomberg, Angel Research
Market Outlook
February 14, 2018
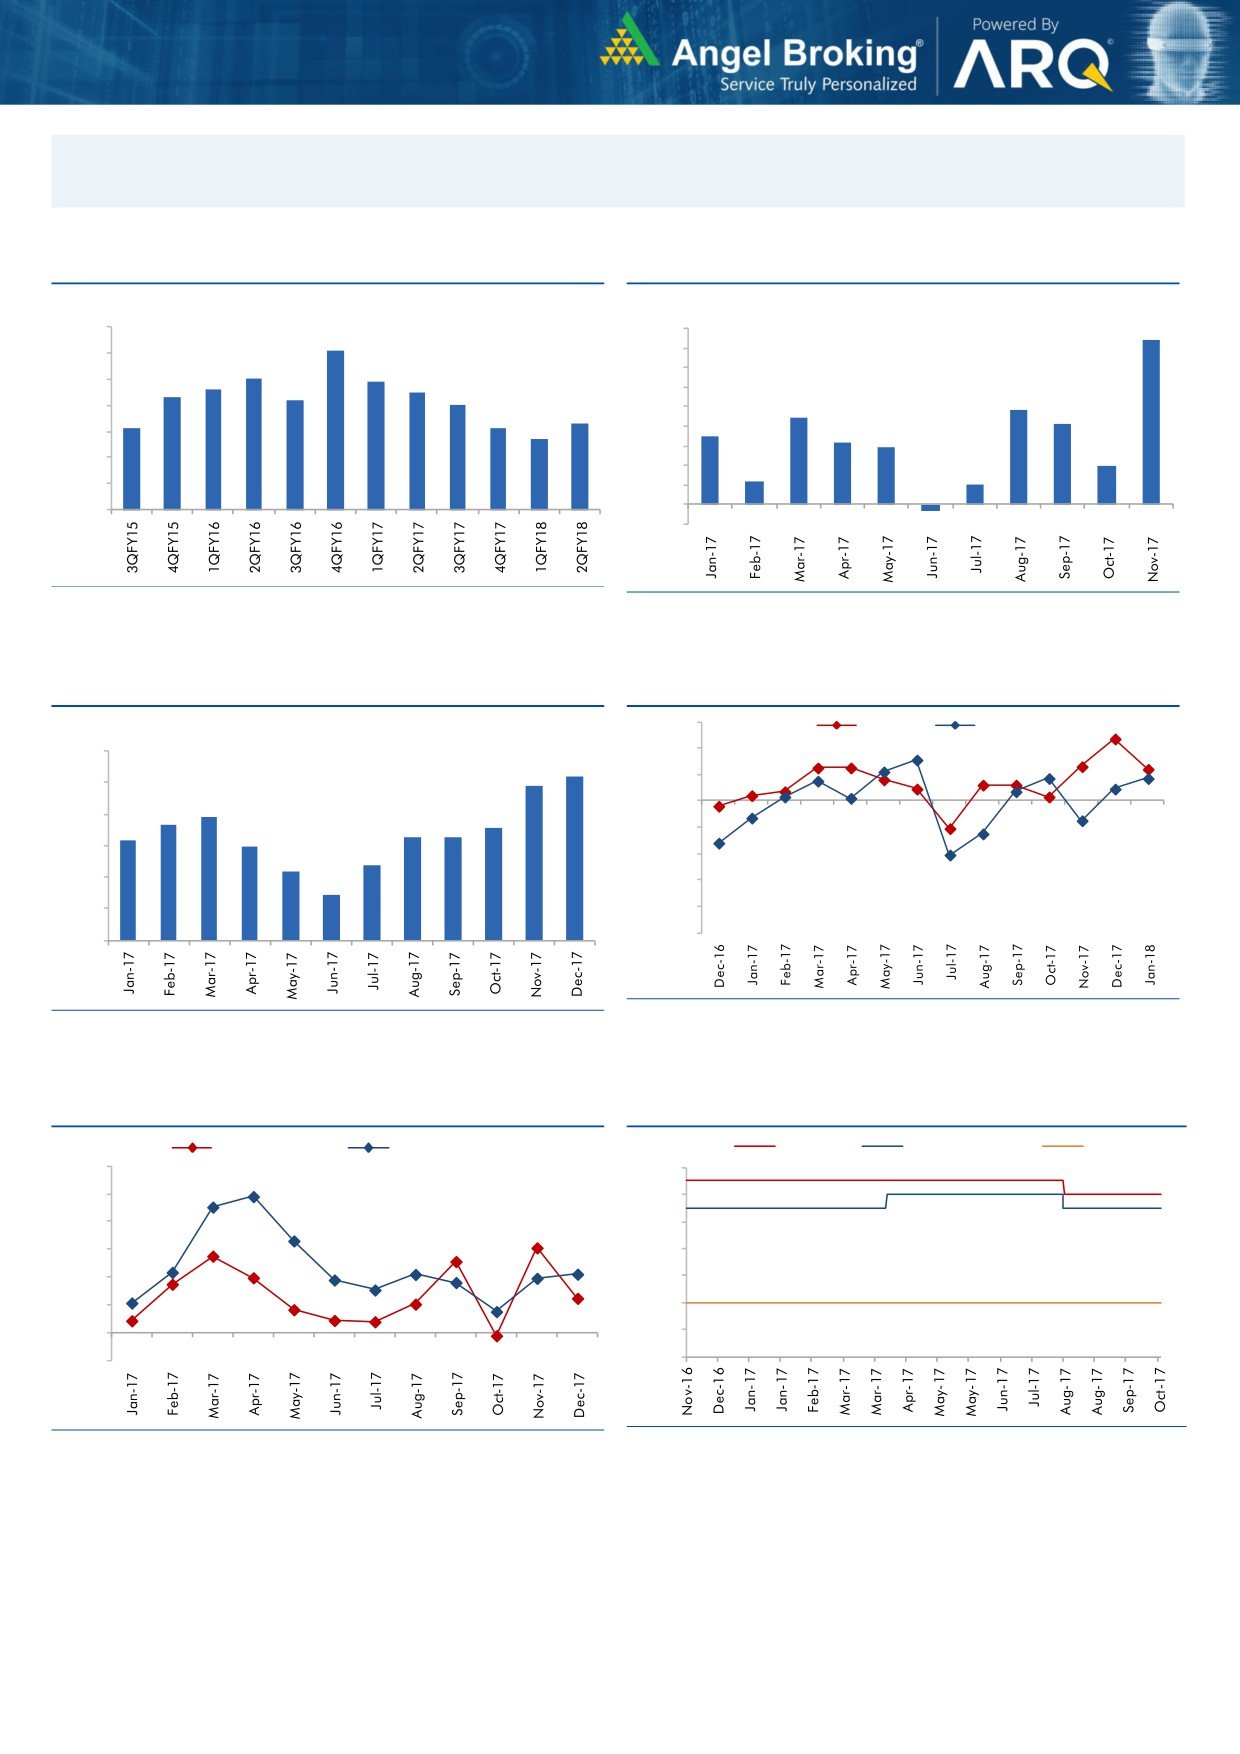
Macro watch
Exhibit 1: Quarterly GDP trends
Exhibit 2: IIP trends
(%)
(%)
10.0
9.0
8.4
9.1
9.0
8.0
8.0
7.9
7.0
7.6
7.5
8.0
7.3
7.2
7.0
6.0
4.8
7.0
6.3
5.0
4.4
4.1
6.1
6.1
5.7
3.5
3.2
6.0
4.0
2.9
3.0
2.0
5.0
2.0
1.2
1.0
4.0
1.0
-
3.0
(1.0)
(0.3)
Source: CSO, Angel Research
Source: MOSPI, Angel Research
Exhibit 3: Monthly CPI inflation trends
Exhibit 4: Manufacturing and services PMI
56.0
Mfg. PMI
Services PMI
(%)
6.0
54.0
5.2
4.9
52.0
5.0
3.9
50.0
3.7
3.6
4.0
3.3
3.3
3.2
3.0
48.0
3.0
2.4
2.2
46.0
2.0
1.5
44.0
1.0
42.0
40.0
-
Source: Market, Angel Research; Note: Level above 50 indicates expansion
Source: MOSPI, Angel Research
Exhibit 5: Exports and imports growth trends
Exhibit 6: Key policy rates
(%)
Exports yoy growth
Imports yoy growth
(%)
Repo rate
Reverse Repo rate
CRR
60.0
6.50
50.0
6.00
40.0
5.50
30.0
5.00
20.0
4.50
10.0
4.00
0.0
3.50
(10.0)
3.00
Source: Bloomberg, Angel Research
Source: RBI, Angel Research
Market Outlook
February 14, 2018
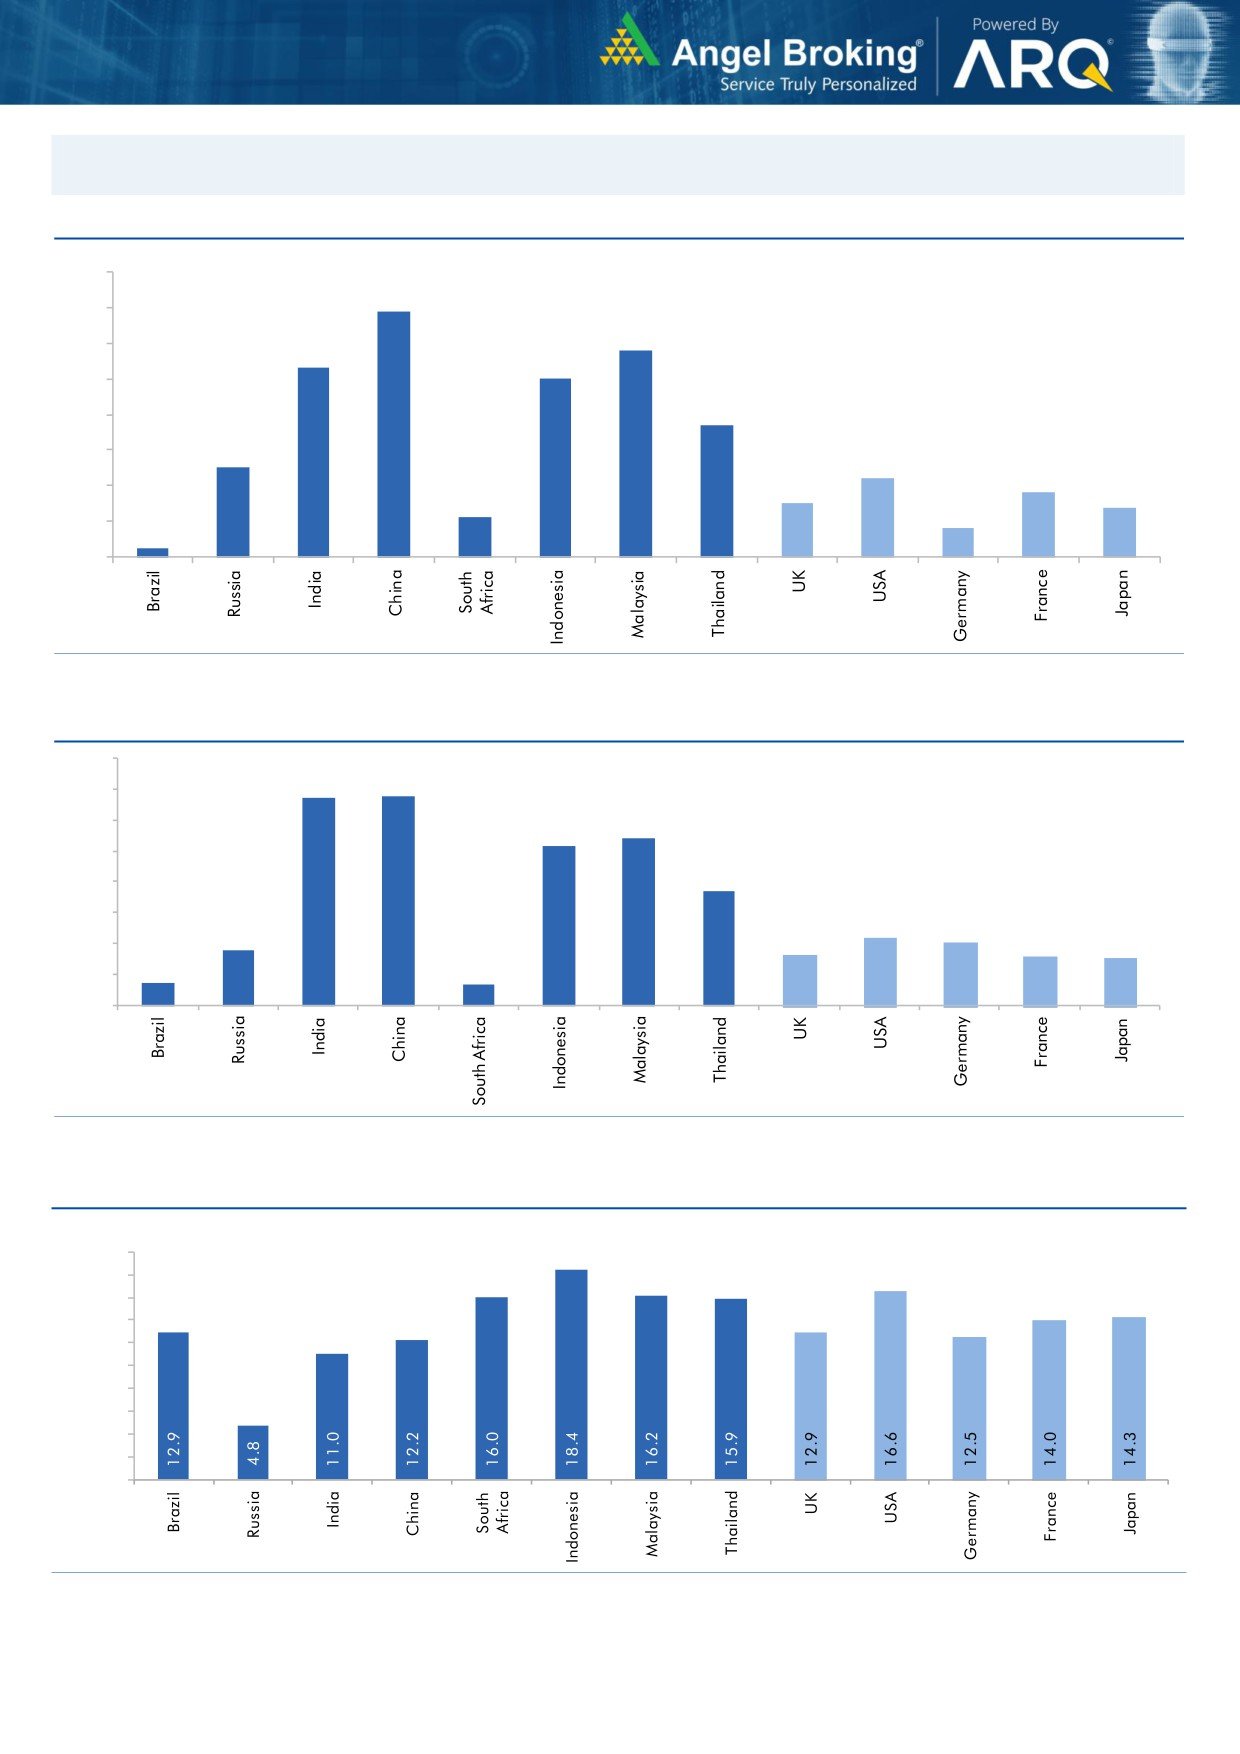
Global watch
Exhibit 1: Latest quarterly GDP Growth (%, yoy) across select developing and developed countries
(%)
8.0
6.9
7.0
5.8
6.0
5.3
5.0
5.0
1.1
3.7
4.0
2.5
3.0
2.2
1.8
2.0
1.5
1.4
0.8
1.0
0.3
-
Source: Bloomberg, Angel Research
Exhibit 2: 2017 GDP Growth projection by IMF (%, yoy) across select developing and developed countries
(%)
6.7
6.8
7.0
6.0
5.4
5.2
5.0
3.7
4.0
3.0
1.8
2.2
2.0
1.7
1.6
2.0
0.7
1.5
0.7
1.0
-
Source: IMF, Angel Research
Exhibit 3: One year forward P-E ratio across select developing and developed countries
(x)
20.0
18.0
16.0
14.0
12.0
10.0
8.0
6.0
4.0
2.0
-
Source: IMF, Angel Research
Market Outlook
February 14, 2018
Exhibit 4: Relative performance of indices across globe
Returns (%)
Country
Name of index
Closing price
1M
3M
1YR
Brazil
Bovespa
80,899
2.6
9.4
25.3
Russia
Micex
2,251
(0.5)
3.8
4.1
India
Nifty
10,540
(0.9)
2.1
20.2
China
Shanghai Composite
3,185
(6.8)
(6.6)
(1.2)
South Africa
Top 40
50,405
(5.4)
(5.7)
10.2
Mexico
Mexbol
47,927
(1.8)
(1.9)
0.6
Indonesia
LQ45
1,109
2.4
10.9
25.2
Malaysia
KLCI
1,833
0.6
5.1
8.8
Thailand
SET 50
1,165
(0.9)
7.7
17.6
USA
Dow Jones
24,640
(3.7)
5.0
20.2
UK
FTSE
7,168
(7.9)
(3.6)
(1.8)
Japan
Nikkei
21,245
(10.4)
(7.4)
12.0
Germany
DAX
12,197
(7.9)
(7.1)
3.6
France
CAC
5,109
(7.4)
(5.0)
5.0
Source: Bloomberg, Angel Research p68in4
Market Outlook
February 14, 2018
Research Team Tel: 022 - 39357800
DISCLAIMER
Angel Broking Private Limited (hereinafter referred to as “Angel”) is a registered Member of National Stock Exchange of India
Limited,Bombay Stock Exchange Limited and Metropolitan Stock Exchange Limited. It is also registered as a Depository Participant with
CDSL and Portfolio Manager with SEBI. It also has registration with AMFI as a Mutual Fund Distributor. Angel Broking Private Limited is a
registered entity with SEBI for Research Analyst in terms of SEBI (Research Analyst) Regulations, 2014 vide registration number
INH000000164. Angel or its associates has not been debarred/ suspended by SEBI or any other regulatory authority for accessing
/dealing in securities Market. Angel or its associates/analyst has not received any compensation / managed or
co-managed public offering of securities of the company covered by Analyst during the past twelve months.
This document is solely for the personal information of the recipient, and must not be singularly used as the basis of any investment
decision. Nothing in this document should be construed as investment or financial advice. Each recipient of this document should make
such investigations as they deem necessary to arrive at an independent evaluation of an investment in the securities of the companies
referred to in this document (including the merits and risks involved), and should consult their own advisors to determine the merits and
risks of such an investment.
Reports based on technical and derivative analysis center on studying charts of a stock's price movement, outstanding positions and
trading volume, as opposed to focusing on a company's fundamentals and, as such, may not match with a report on a company's
fundamentals. Investors are advised to refer the Fundamental and Technical Research Reports available on our website to evaluate the
contrary view, if any.
The information in this document has been printed on the basis of publicly available information, internal data and other reliable
sources believed to be true, but we do not represent that it is accurate or complete and it should not be relied on as such, as this
document is for general guidance only. Angel Broking Pvt. Limited or any of its affiliates/ group companies shall not be in any way
responsible for any loss or damage that may arise to any person from any inadvertent error in the information contained in this report.
Angel Broking Pvt. Limited has not independently verified all the information contained within this document. Accordingly, we cannot
testify, nor make any representation or warranty, express or implied, to the accuracy, contents or data contained within this document.
While Angel Broking Pvt. Limited endeavors to update on a reasonable basis the information discussed in this material, there may be
regulatory, compliance, or other reasons that prevent us from doing so.
This document is being supplied to you solely for your information, and its contents, information or data may not be reproduced,
redistributed or passed on, directly or indirectly.
Neither Angel Broking Pvt. Limited, nor its directors, employees or affiliates shall be liable for any loss or damage that may arise from
or in connection with the use of this information.